AutoMerge performs extrapolation, averaging of experimental .dat
files. On the way it also assesses their quality, amount of data that
is available from them, and checks that files in the same data set fit
to each other up to scaling, background subtraction within range that is
sufficient to infer their similarity.
Two last files are to be used only when merging procedure gives wrong
answer in your case. Otherwise you can just switch off
extrapolation and/or averaging if you wish.
All input files must have the same X axis (the same number of points,
for the same S values.) This is usually true if they come from the same
beamline setup. Otherwise, please use ATSAS package tools to regrid them.
Since program is designed for command-line use, you can use --verbose option once or twice to
increase amount of logging information provided at runtime.
AutoMerge uses only .dat input files containing scattering
data, just as other programs from ATSAS package - columns are s, I(s)
and error(I(s)).
All input files must have the same X axis (the same number of points,
for the same S values.) This is usually true if they come from the same
beamline setup. Otherwise, please use ATSAS package tools to regrid them.
Files results.txt and results.xml are defined as output from AutoPilatus
or AutoMar automated data processing system. See documentation of automated
pipeline for details.
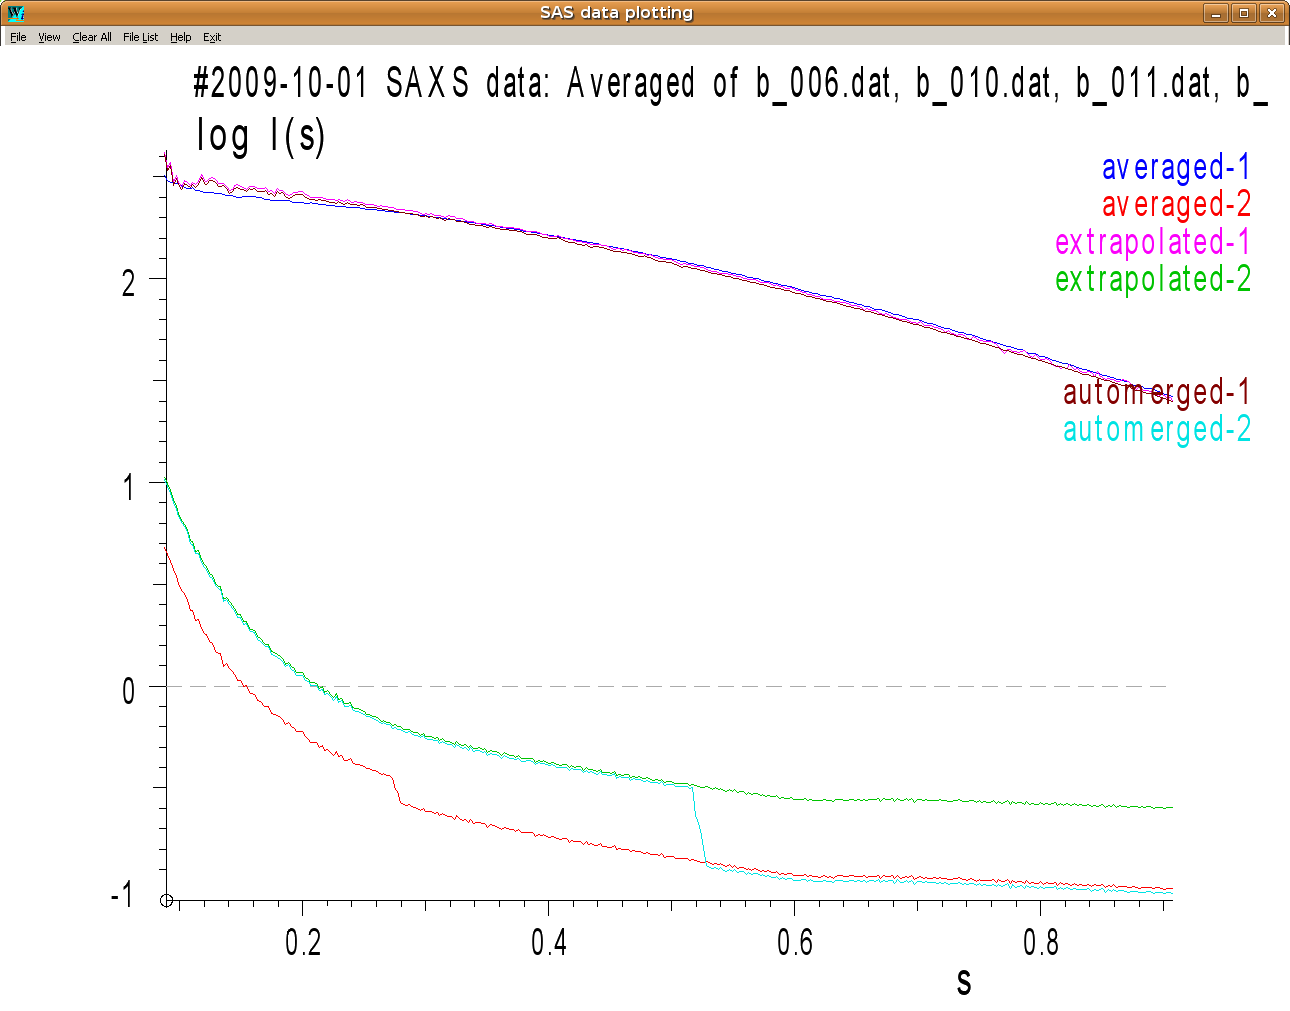
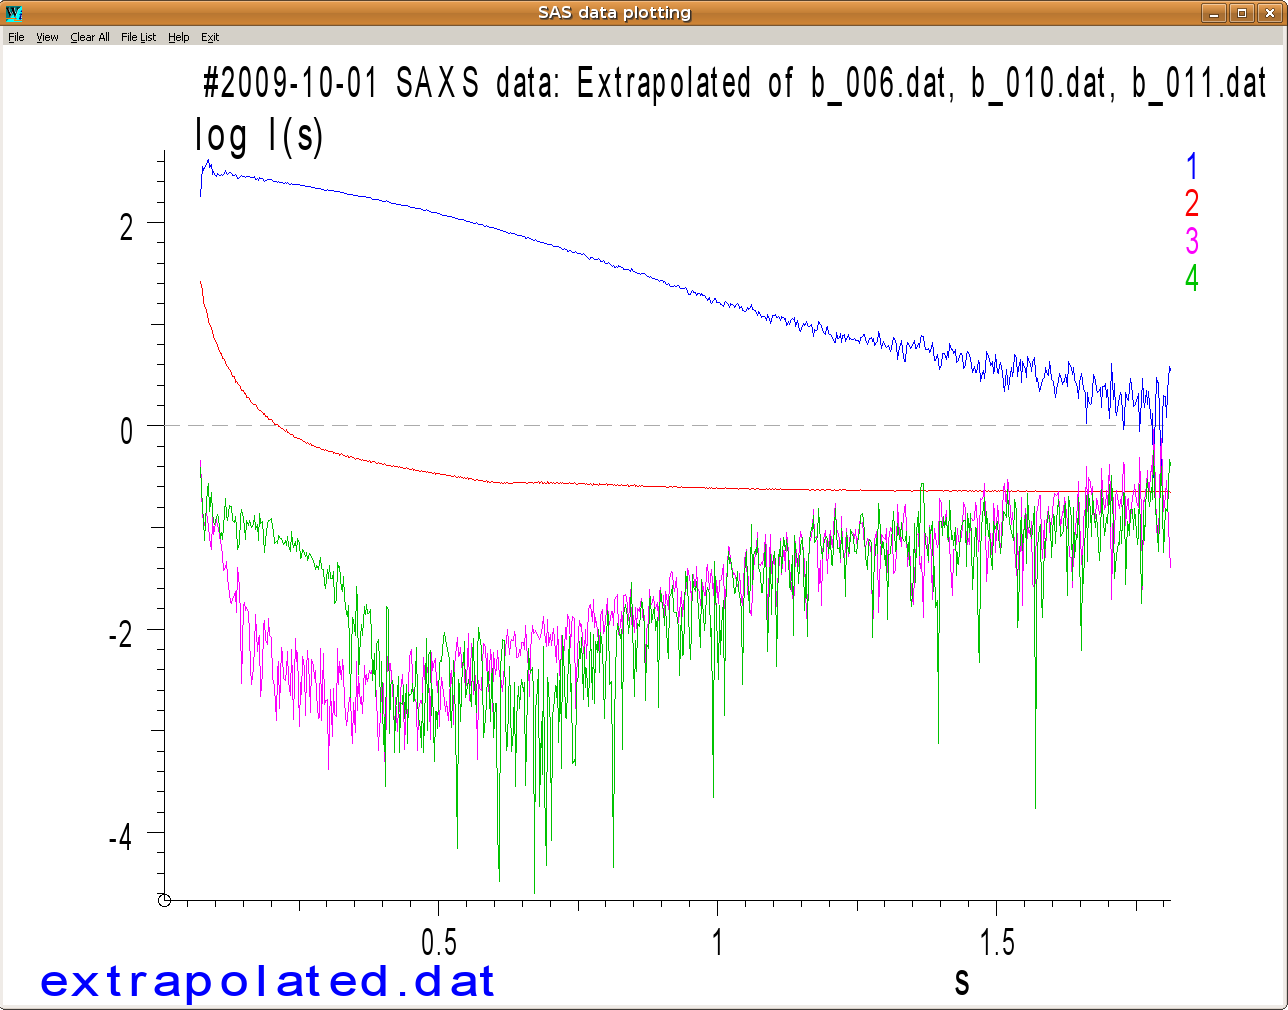
This file contains extrapolated data and two additional columns: 3rd with
statistical estimation of error in extrapolation procedure and 4th with
lower bound on information gained in extrapolation. Extrapolated file
is helpful as long, as the 3rd curve displayed by Windows version of SASPLOT is above the 4th curve.
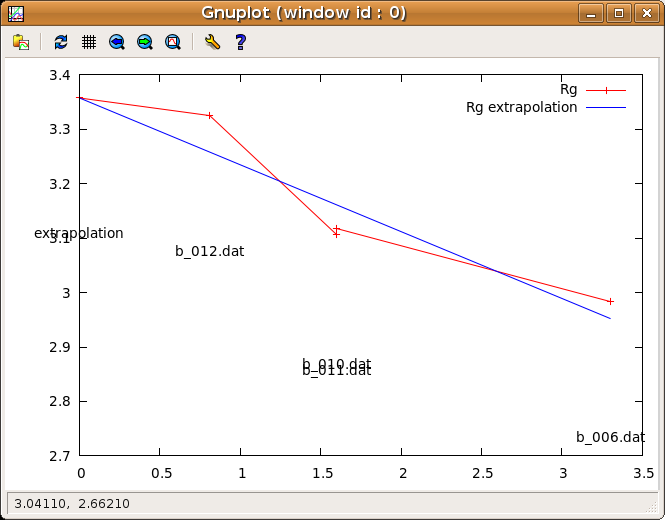
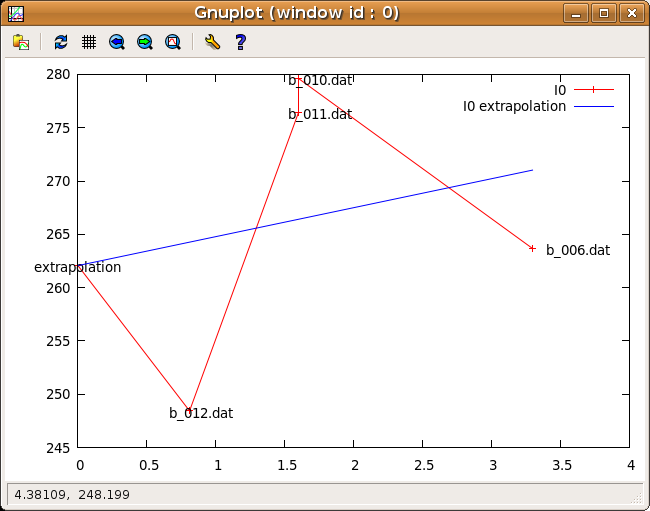
This will create .dat file that shows radii of gyration
and intensities extrapolated to zero angle of all input files, and compare
them with linear extrapolation of respective radii and intensities.
If there are clear outliers, then linear dependency is broken and these
files should not be used for extrapolation.
Here you see that Rg shows perfect concentration dependency,
but I0 is inconsistent. Such situation may indicate beam
stability problems.
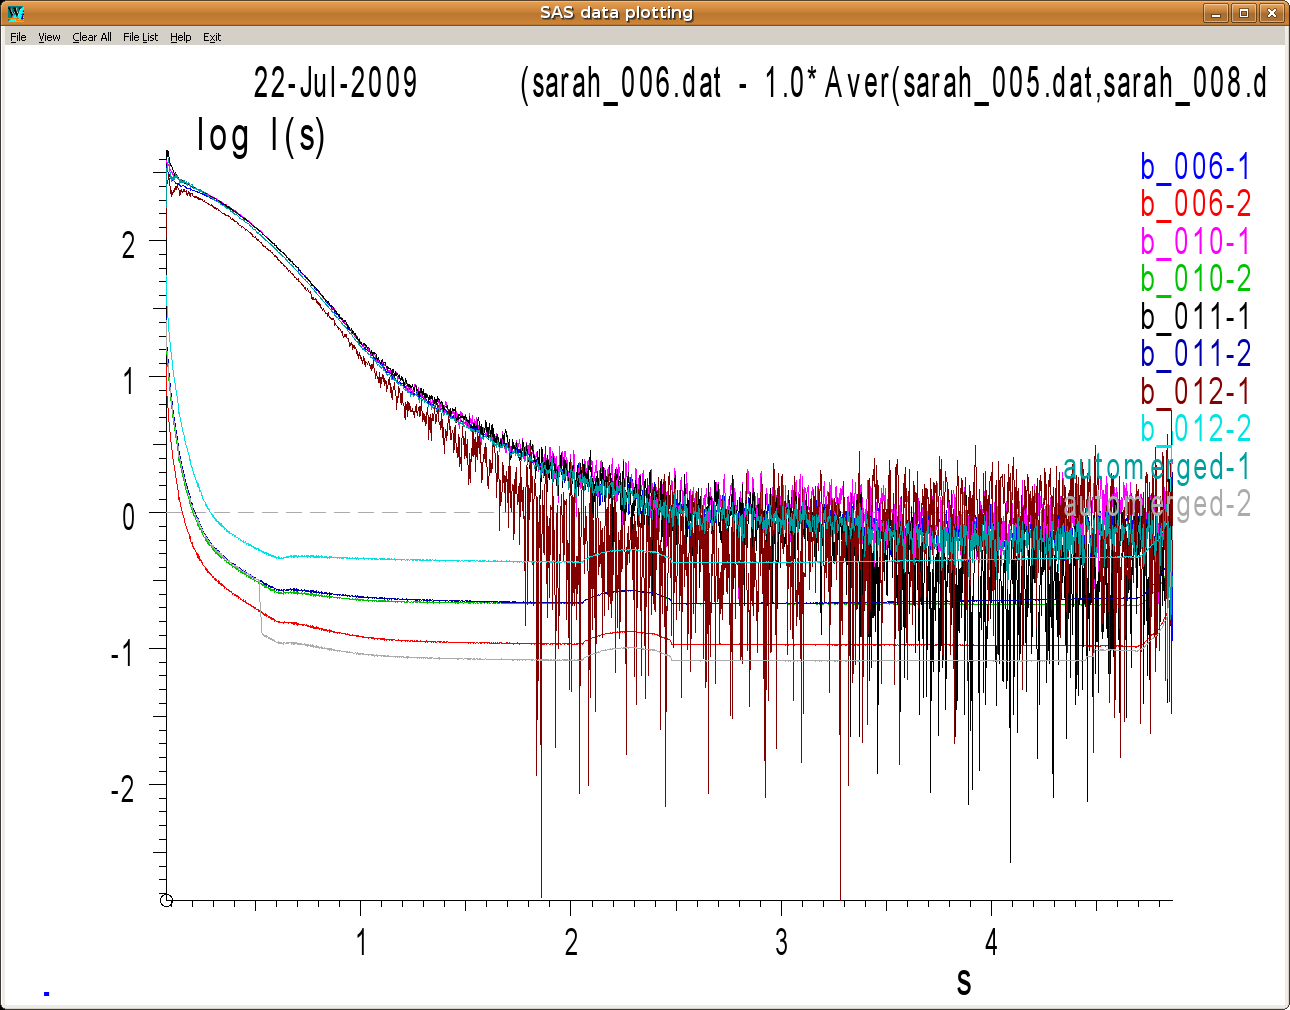
Check if the discontinuity
is bigger than experimental error and divergence (differences
between following points) in the input data. It is so, then it is
insignificant from the numeric point of view. You can also use --verbose mode to get information about
Feasible merging points, and pick different merging point
with --merging-point option.
List of plausible merging point is also visible in the output file under
a metainformation key Possible merging points. Usually you
want earliest merging point that gives a smooth curve.
Check if input data files have this discontinuity - it is quite common
that the detector has edge cases at some points, and there may happen
discontinuities. These points usually correspond to error peaks
in the input .dat files. (At least if errors are properly
estimated.) You can see error peaks by invoking Windows version of SASPLOT on the single input file.
Check if there is a warning about merging averaged and
extrapolated curves that are too dissimilar. If it is so, then
you may want to view both extrapolated and averaged curves in PRIMUS and pick different merging point with --merging-point option (see
1.)
Automerge fails to extrapolate data from a single file.
Probably other files were filtered out as inconsistent or of low
quality, check the reason for filtering out these files in other entries
of this manual. You need at least three files for extrapolation.
Reasons for filtering out files will be indicate in the merged output.
Automerge omits my file because Rg/sigma_Rg/Rg
quality are not right or are missing.
You may use --rg/--sigma-rg
option to pick Rg by hand, and thus avoid relying on
AutoRG.
Or you may prefer to write/modify results.txt or
results.xml file and change Rg and sigma_Rg
values. You can use --no-autorg
and --results-txt or --results-xml option. [They are
called Rg and ErrRg, respectively.]
Result of automerging is visible below:
Inspection of extrapolated data suggests that less extrapolated
data should be used - just until s≤0.4 nm-1. (Green
curve is estimated gain from extrapolation, whereas pink is
inherent error of extrapolation.) This can be done with
--merging-point option: