|
|
Biological Small Angle Scattering |
|
|
|
| ATSAS online | Forum | User information | EMBL Hamburg |
|
|
MIXTURE manualWritten by P.V. Konarev, V.V Volkov and D.I. Svergun. © ATSAS Team, 2003-2009 Table of ContentsManualProgram MIXTURE makes the fitting to the experimental scattering curve by modelling the multicomponent system represented by simple geometrical bodies taking into account interparticle interactions. If you use results from MIXTURE in your own publication, please cite: IntroductionThe model scattering intensity may be represented by the linear combination of four several types of particles: The scattering intensity can be expressed as follows: 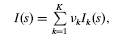 where νk and Ik(s) are the volume fraction and the scattering intensity from the k-th component, respectively. For mixtures of different types of particles with possible polydispersity ad interactions between particles of the same components, the scattering intensity from a component can be represented as ![I(s) = S_{k}(s) \int_{0}^{\infty} D_{k}(R) V_{k}(R) \left[ \Delta\rho_{k}(R) \right]^2 i_{0k}(s,R) \mathrm{d}R](mixture/formula2.png) where Δρk(R), Vk(R) and iok(s,R) denote the contrast, volume and normalized scattering intensity (form factor) of the particle with size R (these functions are defined by the shape and internal structure of the particles, and iok(0,R)=1 ), whereas Sk(s) is the sturcture factor describing the inteference effects for the k-th component. Each component can be monodisperse or polydispers and in the second case the size polydispersity Dk(R) is described by a two-parametric monomodal Gaussian or Schultz distribution characterized by the average dimension Rok(R) and dispersion ΔRk(R) The spheres and cylinders may have complicated features: 1. polydispersity on radius with Gauss or Schultz distribution 2. two shells with different contrasts (zero contrast of the inner shell means the hole sphere or cylinder). The interparticle interactions between sphere particles can be described by structure factor calculated within Percus-Yevick approximation for hard-sphere or sticky hard-sphere potential.(see Baxter, 1968) described by two parameters: the hard-sphere interaction radius Rkhs and the "stickiness" τk. MIXTURE allows one to model mixtures containing up to ten different components (i.e. different types of particles) Running MIXTUREConfigurationBelow there is the list of the fitting parameters for each type of particles: SPHERE (PHASE 1)
Possible variants: monodisperse or polydisperse spheres, solid spheres or spheres with hollows interactive or non-interactive spheres CYLINDER (PHASE 2)
Possible variants: monodisperse or polydisperse cylinders, solid cylinders or cylinders with hollows ELLIPSOID (PHASE 3)(ellipsoid of rotation with R, R, v*R semiaxes)
Possible variants: monodisperse ellipsoids DUMB-BELL (PHASE 4)(two sticked spheres) parameters the same as for SPHERE (PHASE 1) Running OutputTo start the program one has to have both mixture.exe and mixture.cmd (see MIXTURE Input Files ) files in one directory and run with the following command: MIXTURE.EXE < MIXTURE.CMD _/_/ _/_/_/_/_/ _/_/_/_/_/_/ _/_/_/_/_/_/ _/_/_/_/ _/_/_/_/_/
_/_/ _/_/ _/_/ _/_/ _/_/ _/_/ _/_/ _/_/
_/_/ _/_/ _/_/ _/_/ _/_/ _/_/ _/_/
_/_/ _/_/ _/_/ _/_/ _/_/ _/_/ _/_/_/_/_/
_/_/ _/_/ _/_/_/_/_/_/ _/_/ _/_/ _/_/
_/_/ _/_/ _/_/ _/_/ _/_/ _/_/ _/_/
_/_/_/_/_/ _/_/ _/_/ _/_/_/_/ _/_/_/_/_/ _/_/
DIALOGUE SERVICE PROGRAM FOR MINIMIZATION OF NONLINEAR MULTIVARIATE
FUNCTIONS.
Program MIXTURE uses the optimization program suite OPTIS written by V.V. Volkov (Institute of Crystallography, Moscow, Russia) e-mail: vvo@ns.crys.ras.ru
Dialogue mode [ Interactive / PASSive ] ...... < Inter. >:
OPTIS:  OPTIS:  Welcome to user's problem
 Enter the series title .................................:   Enter comment line
.....................................:  Enter Number of phases ................
 <            0 >:  Enter concentration of the system ...... <          0.0 >:
 Choose type of data file format:.
                                                      1: OTOKO format
                                                      2: ASCII format
Enter the format code .................. <            2 >:  Enter INTENSITY fil
 name .............. <         .dat >:    339703.100000000        10.4556000000
00
Angular units in the input file :
4*pi*sin(theta)/lambda [1/angstrom] (1)
4*pi*sin(theta)/lambda [1/nm      ] (2)
2*   sin(theta)/lambda [1/angstrom] (3)
 2*   sin(theta)/lambda [1/nm      ] (4) <            1 >:  Enter Fraction of t
e curve ............ <          0.0 >:           75         101
 I(1), I(last)    :   339703.100000000        10.7711200000000
 s(1), s(last)    :  3.229300000000000E-002  0.421600000000000
 Err(1), Err(last):   10191.0900000000       0.323133500000000
15-dimensional user's problem
OPTIS:  OPTIS:  OPTIS:  ///////////////////////////////////////////////////////
//////////////
This is the information which was read from the command file. OPTIS --- Version 5.6 rev. 09 May 02 03:30 reports current information:
08-Oct-2009 time 10:42:37
Objective function -- : User's problem (15-dimensional): 0
Chosen algorithm ---- : B-F-G-S with simple bounds
number of performed function evaluations ----- : 1
number of performed iterations --------------- : 0
number of performed gradient estimations ----- : 0
maximum number of function evaluations ------- : 5250
maximum number of search iterations ---------- : 40
total number of problem variables ------------ : 15
number of problem variables to be varied ----- : 15
maximum allowed number of variables ---------- : 512
function value ------------------------------- : 5.678e-2
rel/abs function tolerance to be attained ---- : 0.0
tolerance multiplier switch ------------------ : 0.0 (OFF)
upper bound on hessian condition number ------ : 0.0 (OFF)
temperature and scedule factor --------------- : 0.0, 0.0
function computation noise (rel/abs) --------- : 0.0
relative machine precision ------------------- : 2.22e-16
message level -------------------------------- : 1
===> Press CR to continue: ---------------------------------------------------
------------------
fixative-vector
1 1 1 1 1 1 1 1 1 1
1 1 1 1 1
----------------------------------------------------------------------
argument values
0.500000 0.00000 0.00000 48.0000 1.00000
5.00000 55.0000 0.00000 0.500000 0.00000
0.00000 40.0000 1.00000 3.00000 300.000
----------------------------------------------------------------------
lower bounds on variables
0.00000 0.00000 0.00000 40.0000 1.00000
0.100000 48.0000 0.00000 0.00000 0.00000
0.00000 30.0000 1.00000 2.10000 300.000
----------------------------------------------------------------------
upper bounds on variables
1.00000 0.00000 0.00000 60.0000 1.00000
25.0000 85.0000 0.00000 1.00000 0.00000
0.00000 60.0000 1.00000 10.1000 300.000
//////////////////////////////////////////////////////////////////////
The information about minimization method (it uses B-F-G-S with simple bounds) and the argument values (its initial values, lower and upper boundaries). CPU time used: 0 min 0.02 sec Continue? [ Y / N ] < Yes >: E04JAF a|Itr.Rem.| No.of F | F | cond(H | E04JAF a| 40| 0| 5.678e-2| 6.295| E04JAF a| 39| 9| 3.509e-2| 8.380| E04JAF a| 38| 18| 4.007e-3| 17.01| E04JAF a| 37| 27| 3.483e-3| 2.358| E04JAF a| 36| 36| 3.109e-3| 246.7| E04JAF a| 35| 45| 3.099e-3| 170.6| E04JAF a| 34| 56| 3.068e-3| 4.026| E04JAF a| 33| 65| 3.046e-3| 2.668| E04JAF a| 32| 78| 2.715e-3| 476.2| E04JAF a| 31| 86| 2.651e-3| 447.6| The value of minimization tagret function at each iteration step.
E04JAF a|Itr.Rem.| No.of F |     F      |  cond(H)   |
E04JAF a|      30|       94|    1.739e-3|       512.1|
E04JAF a|      29|      104|    1.557e-3|       531.3|
E04JAF a|      28|      113|    1.442e-3|       652.1|
E04JAF a|      27|      122|    1.385e-3|       628.3|
E04JAF a|      26|      131|    1.349e-3|       1082.|
E04JAF a|      25|      140|    1.312e-3|       2145.|
E04JAF a|      24|      149|    1.291e-3|       2115.|
E04JAF a|      23|      158|    1.251e-3|       2370.|
E04JAF a|      22|      167|    1.185e-3|       2259.|
E04JAF a|      21|      176|    1.167e-3|       1794.|
E04JAF a|Itr.Rem.| No.of F |     F      |  cond(H)   |
E04JAF a|      20|      185|    1.163e-3|       1680.|
E04JAF a|      19|      194|    1.162e-3|       1485.|
E04JAF a|      18|      202|    1.162e-3|       1383.|
E04JAF a|      17|      211|    1.162e-3|       1302.|
E04JAF a|      16|      227|    1.162e-3|       1444.|
E04JAF a|      15|      244|    1.162e-3|       1456.|
E04JAF b|      14|      260|    1.162e-3|       1731.|
E04JBM --- Local search attempt...
E04JAF c|      14|      268|    1.162e-3|       1731.|
OPTIS:  OPTIS:  15-dimensional user's problem
Function no. 20,     301 value =  1.1621442432225761E-03

OPTIS:  OPTIS:
Are you sure of the solution? [ Y / N ]  < No >:
Remember to save your results before you leave "OPTIS"!

Exit now? [ Y / N ] .................... < No >:
           Well, absolute accuracy requires infinite time...

----------------------------- END OF JOB -----------------------------
Final Function value. (In ideal fit it should approach to zero) Produced function minimum is equal to 0.1162144E-02 at the point: 0.987769 0.00000 0.00000 54.1704 1.00000 7.11431 55.0000 0.00000 0.614604 0.00000 0.00000 45.2565 1.00000 4.02500 300.000 Optimized values for the arguments.
after        301 function evaluations,
               0 gradient evaluations,
               0 iterations
CPU time used:       0 min  4.61 sec
E4MAIN --- Normal termination
MIXTURE Input FilesFor running the program MIXTURE it is necessary to prepare the command file where one has to specify your model and initial values of parameters for this model, i.e. the number of "phases" (components), the type for each component (SPHERE, CYLINDER, ELLIPSOID, DUMBBELL), dimension parameters (relative volume fraction, average sphere radius, its polydispersity, type of distribution function (Gauss or Schultz) etc., the upper and lower boundary values for all fitting parameters. Below there are two examples of command file for the model containing different types of components (example 1- spheres+cylinders, example 2 - ellipsoids+dumb-bells) one can design the model containing several components of the same type (for example large and small spheres, long and short cylinders etc.), but in all cases one has to follow the thumb rule of describing the model parameters as it is done in this example command file: Below symbols !! are used for comments. For your convienence it is recommended to keep the comments on each line, the program will automatically detect them. Example Command File 1 (spheres+cylinders)i !! Two initialising !!!!!!!!!!!!!!!!!! !! strings pro us !! Command "Problem user" Some description !! Comment Line 1 (done by user ) Some description !! Comment Line 2 (done by user ) EXPERIMENT !! MODE FOR FITTING DATA, "TEST" MODE FOR EXPERTS 2 !! Number of Phases (2 for this example) 0.20 !! System Concentration SPHERE !! Type of the first Phase 0.25 0.0 1.0 !! sphere volume Fraction 0.0 0.0 0.0 !! inner shell sphere radius 0.0 0.0 0.0 !! density(contrast) for inner shell (hollow sphere) 48.0 40.0 60.0 !! outer shell sphere radius 1.0 1.0 1.0 !! density(contrast) for outer shell 5.0 0.1 25.0 !! sphere polydispersity 75.0 55.0 95.0 !! interaction radius for spheres (hard sphere radius) 2 !! type of distributions for spheres (1 - Gauss, 2 - Schultz) 0.0 0.0 0.0 !! sticky parameter (0.1 .GT. tau .LT. 100), if tau=0 no interactions CYLINDER !! Type of the second Phase 0.25 0.0 1.0 !! cylinder volume Fraction 0.0 0.0 0.0 !! inner shell cylinder radius 0.0 0.0 0.0 !! density(contrast) for inner shell 40.0 30.0 60.0 !! outer shell cylinder radius 1.0 1.0 1.0 !! density(contrast) for outer shell 3.0 2.1 10.1 !! cylinder outer shell radius polydispersity 2 !! type of distributions for cylinders (1 - Gauss, 2 - Schultz) 300.0 !! cylinder length 2 !! type of data (1 - for OTOKO format, 2 - for ASCII format) test1.dat !! experimental file data 1 !! scale for s-vector in A*(-1) (1 for 1.0 coefficient) 1.0 !! fraction of data taken for evaluation meth sb !! method for minimization (Quasi-Newton with simple bounds) loa maxit 40 !! maximum number of iterations 40 run !! run minimisation process y !! confirm running y !! confirm running mes 14 !! message for saving the output data > eva !! write data mes 1 !! prepare for next set data ex !! exit the program y !! confirm exit y !! confirm exit Example Command File 2 (ellipsoids+dumbbells)i !! Two initialising !!!!!!!!!!!!!!!!!! !! strings pro us !! Command "Problem user" Some description !! Comment Line 1 (done by user ) Some description !! Comment Line 2 (done by user ) EXPERIMENT !! MODE FOR FITTING DATA, "TEST" MODE FOR EXPERTS 2 !! Number of Phases (2 for this example) 0.20 !! System Concentration ELLIPSOID !! Type of the third Phase ( sph, cyl, dmb, ell) 0.25 0.0 1.0 !! ellipsoid Fraction 90.0 20.0 100.0 !! SemiAxis for Ellipsoid (Radius r) 1.5 0.5 3.0 !! Ratio of SemiAxes "v" for Ellipsoid (semiaxes r,r,v*r) DUMBBELL !! Type of the fourth Phase ( sph, cyl, dmb, ell) 0.25 0.0 1.0 !! volume Fraction of dumbbells 0.0 0.0 0.0 !! inner sphere radius 0.0 0.0 0.0 !! density(contrast) for inner shell 62.3 40.0 80.0 !! outer sphere radius 1.0 1.0 1.0 !! density(contrast) for outer shell 2.0 0.1 25.0 !! sphere polydispersity 2 !! type of distributions for spheres in dumbbell 2 !! type of data (1 - for OTOKO format, 2 - for ASCII format) test1.dat !! experimental file data 1 !! scale for s-vector in A*(-1) (1 for 1.0 coefficient) 1.0 !! fraction of data taken for evaluation meth sb !! method for minimization (Quasi-Newton with simple bounds) loa maxit 40 !! maximum number of iterations 40 run !! run minimisation process y !! confirm running y !! confirm running mes 14 !! message for saving the output data > eva !! write data mes 1 !! prepare for next set data ex !! exit the program y !! confirm exit y !! confirm exit To start the program one has to have both mixture.exe and mixture.cmd files in one directory and run with the following command: MIXTURE.EXE < MIXTURE.CMD MIXTURE Output FilesThe output files of the program mixture are the following: 3 files with extensions *.fit, *.pam, *.str, where the names of files coincide with the file name of experimental data as well as mixture.log file
Mixture.log file contains information about the file name of experimental data and obtained fitting parameters for your model for each component. After each run the program mixture adds information to this file, so you will have the whole history of running the program in this file. |
||||||||||||||||||||||||||||||||||||||||||||||||||||
Last modified: April 11, 2013
© BioSAXS group 2013